Epidemic & Trade Network Applications
Doctoral research, Virginia Tech, 2013–2018, supervised by Prof. Stephen Eubank. The theoretical foundation is Moore-Shannon network reliability, described in detail on the network reliability project page: a polynomial that encodes both network structure and the dynamics of a process running on it. That framework is applied here to two systems: human contact networks, where it reveals how standard graph models fail to reproduce epidemic dynamics even when they closely match local statistics; and international food trade networks, where it identifies stable clusters of countries that share vulnerability to a crop-borne invasive species. In both cases, the framework reveals structure that standard methods miss.
Full dissertation ↗ · Journal of Theoretical Biology (2018) ↗
SIR Dynamics on Contact Networks
Infectious diseases spread through contact networks — graphs in which each person is a node and each potential transmission route an edge. Under the SIR model, each person is susceptible \((S)\), infectious \((I)\), or recovered \((R)\). An infectious person transmits to each susceptible contact independently with probability \(x\). The central question is whether networks constructed to match observed local statistics also reproduce the epidemic dynamics observed on the real network. The answer matters for public health: if standard graph models cannot reproduce real epidemic dynamics, then intervention strategies designed using those models — vaccination targeting, quarantine timing — may be unreliable.
\(R(x;\,\mathcal{G},D_\text{SIR},\mathcal{P}_N)\) gives the probability that infecting a single randomly chosen node leads to an outbreak involving at least \(N\) people, where \(x\) is the per-edge transmission probability. It is a finite-degree polynomial in \(x\) that captures both network topology and epidemic dynamics in a single quantity.
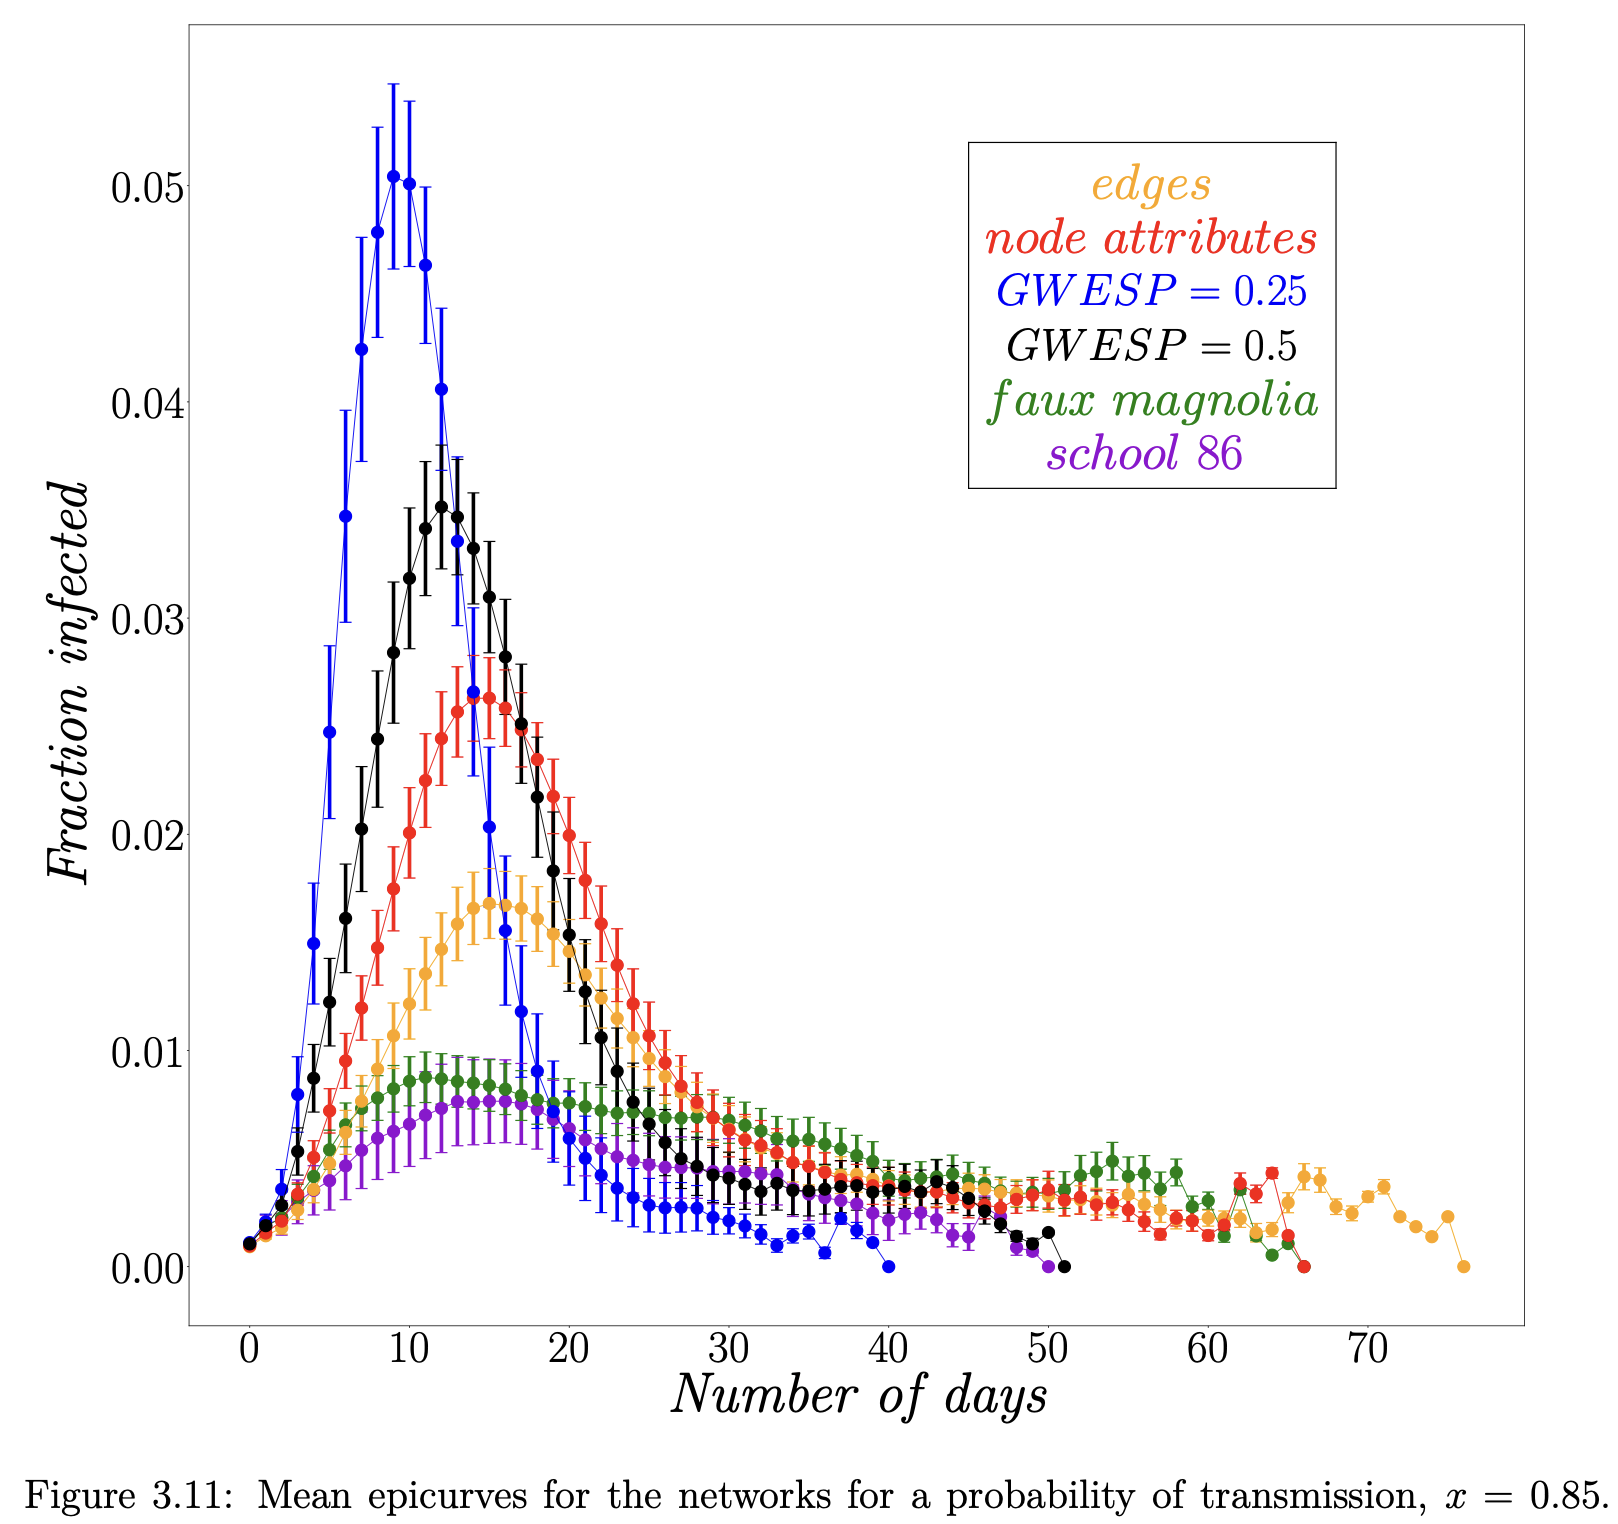
The observed network is school 86 — a friendship network drawn from Wave I of Add Health (the National Longitudinal Study of Adolescent to Adult Health), a large US government-funded survey that followed a nationally representative sample of adolescents from the mid-1990s into adulthood, tracking health, social relationships, and behaviour over time. Wave I, collected in 1994–1995, included detailed data on friendship networks within schools. School 86 — the Add Health identifier for this community — covers two linked high schools with 1,460 students and 974 mutual friendship links.
Against this, exponential random graph models (ERGMs) provide the controlled comparison. ERGMs generate random networks constrained to match a target on specified graph statistics, while leaving all other structure unconstrained — which makes them the standard tool for asking exactly this question. The test is direct: if a synthetic network that matches school 86 on edge count, node attributes, clustering, and the distribution of shared connections still fails to reproduce its epidemic dynamics, those statistics alone do not determine how an epidemic unfolds. The Faux Magnolia network, a widely-used ERGM comparison network drawn from the same dataset, serves as the primary comparison.
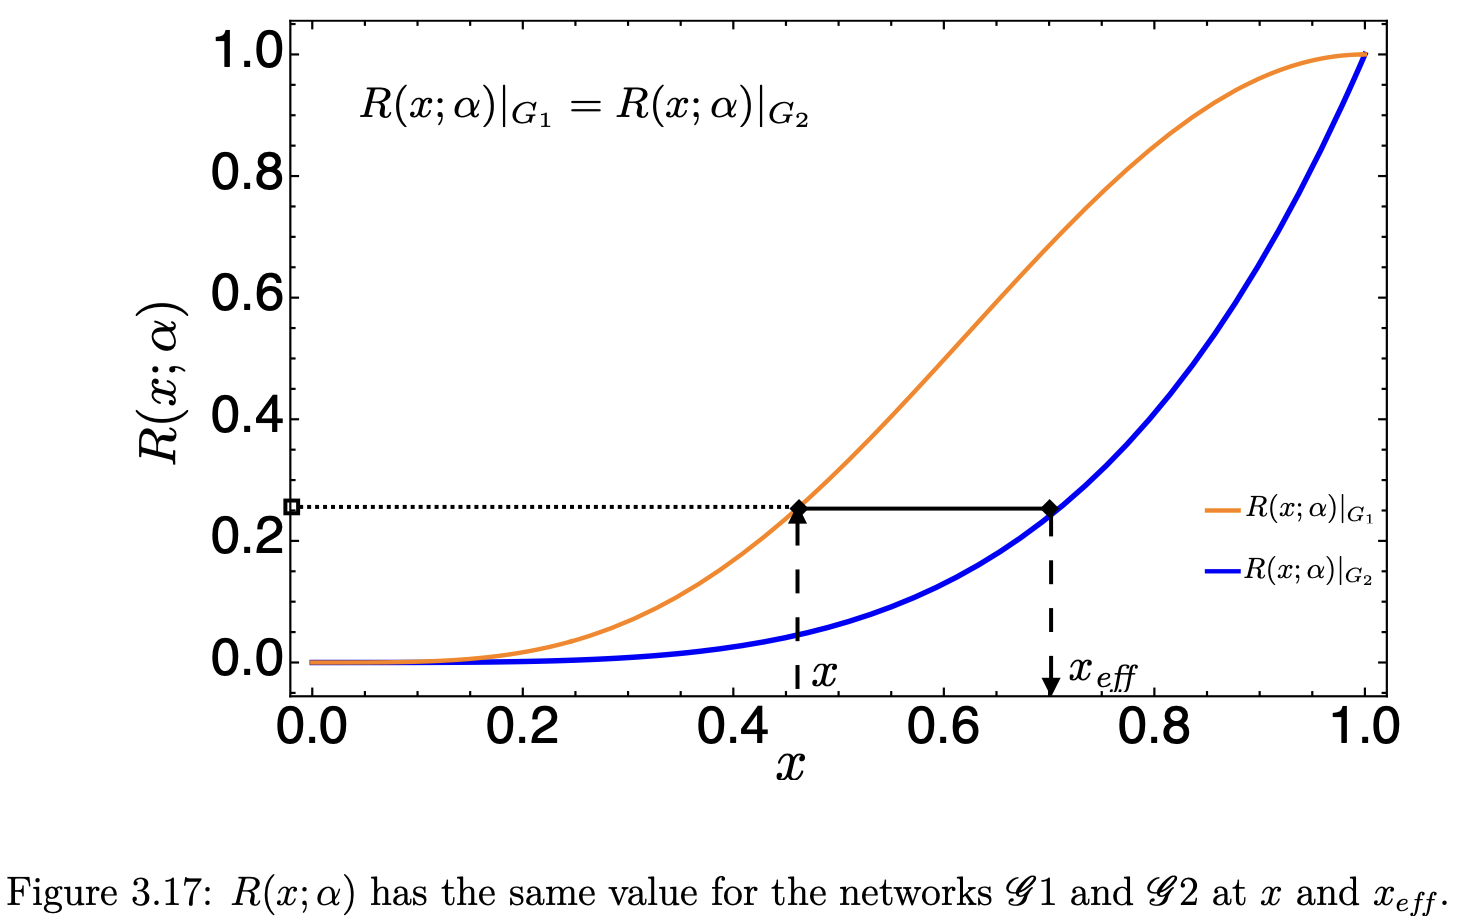
Computing \(R(x;\,\mathcal{G},D_\text{SIR},\mathcal{P}_N)\) for each network shows that school 86 is significantly more resistant to large outbreaks than any of the ERGMs, even those that closely match the graph statistics they were constructed to match. At the same transmission probability, ERGMs overestimate infection numbers by up to 50%. To ask whether this gap is purely in overall infectiousness or also in the shape of the epidemic, transmission probability is then re-calibrated so that all networks share the same epidemic potential — the same overall probability of a large outbreak. Systematic differences in peak infection height and outbreak duration persist even after re-calibration. More strikingly, a less constrained random network, once re-calibrated, performs as well as or better than Faux Magnolia: adding more constraints to match local statistics does not improve how well the model reproduces real epidemic dynamics, and can introduce spurious global structure.
The conclusion is that how widely an outbreak spreads depends on global topological features not captured by degree distribution or clustering. Standard summary statistics are insufficient to characterise epidemic dynamics, and observed contact network data remains essential when designing and evaluating intervention strategies such as vaccination.
Invasive Species Spread in Food Trade Networks
The same mathematical framework extends naturally to trade networks. Whether a disease spreads through a population or a pest spreads through a food supply chain, the structure is the same: spread follows edges, and network reliability captures the probability and scale of that spread. The global food system depends on long-distance trade in agricultural commodities, which creates pathways for invasive species and crop pests to spread between countries. This work applies Moore-Shannon network reliability to identify contagion clusters in international food trade networks — groups of countries with shared vulnerability, where a pest entering one country substantially increases the likelihood of spread to the others.
The case study is Tuta absoluta (South American tomato leafminer), an invasive pest that has spread from its native South America to most of Europe, Africa, and West, Central, and South Asia. Tuta absoluta feeds primarily on plants of the Solanaceae family, making trade in those crops — tomato, potato, eggplant, and pepper — the relevant transmission pathway. Data comes from the FAO (Food and Agriculture Organization of the United Nations) Detailed Trade Matrices at country level, covering 2005–2013. Edge weights are set to the maximum of reported export and import volumes between each country pair, representing a worst-case scenario for contagion risk.
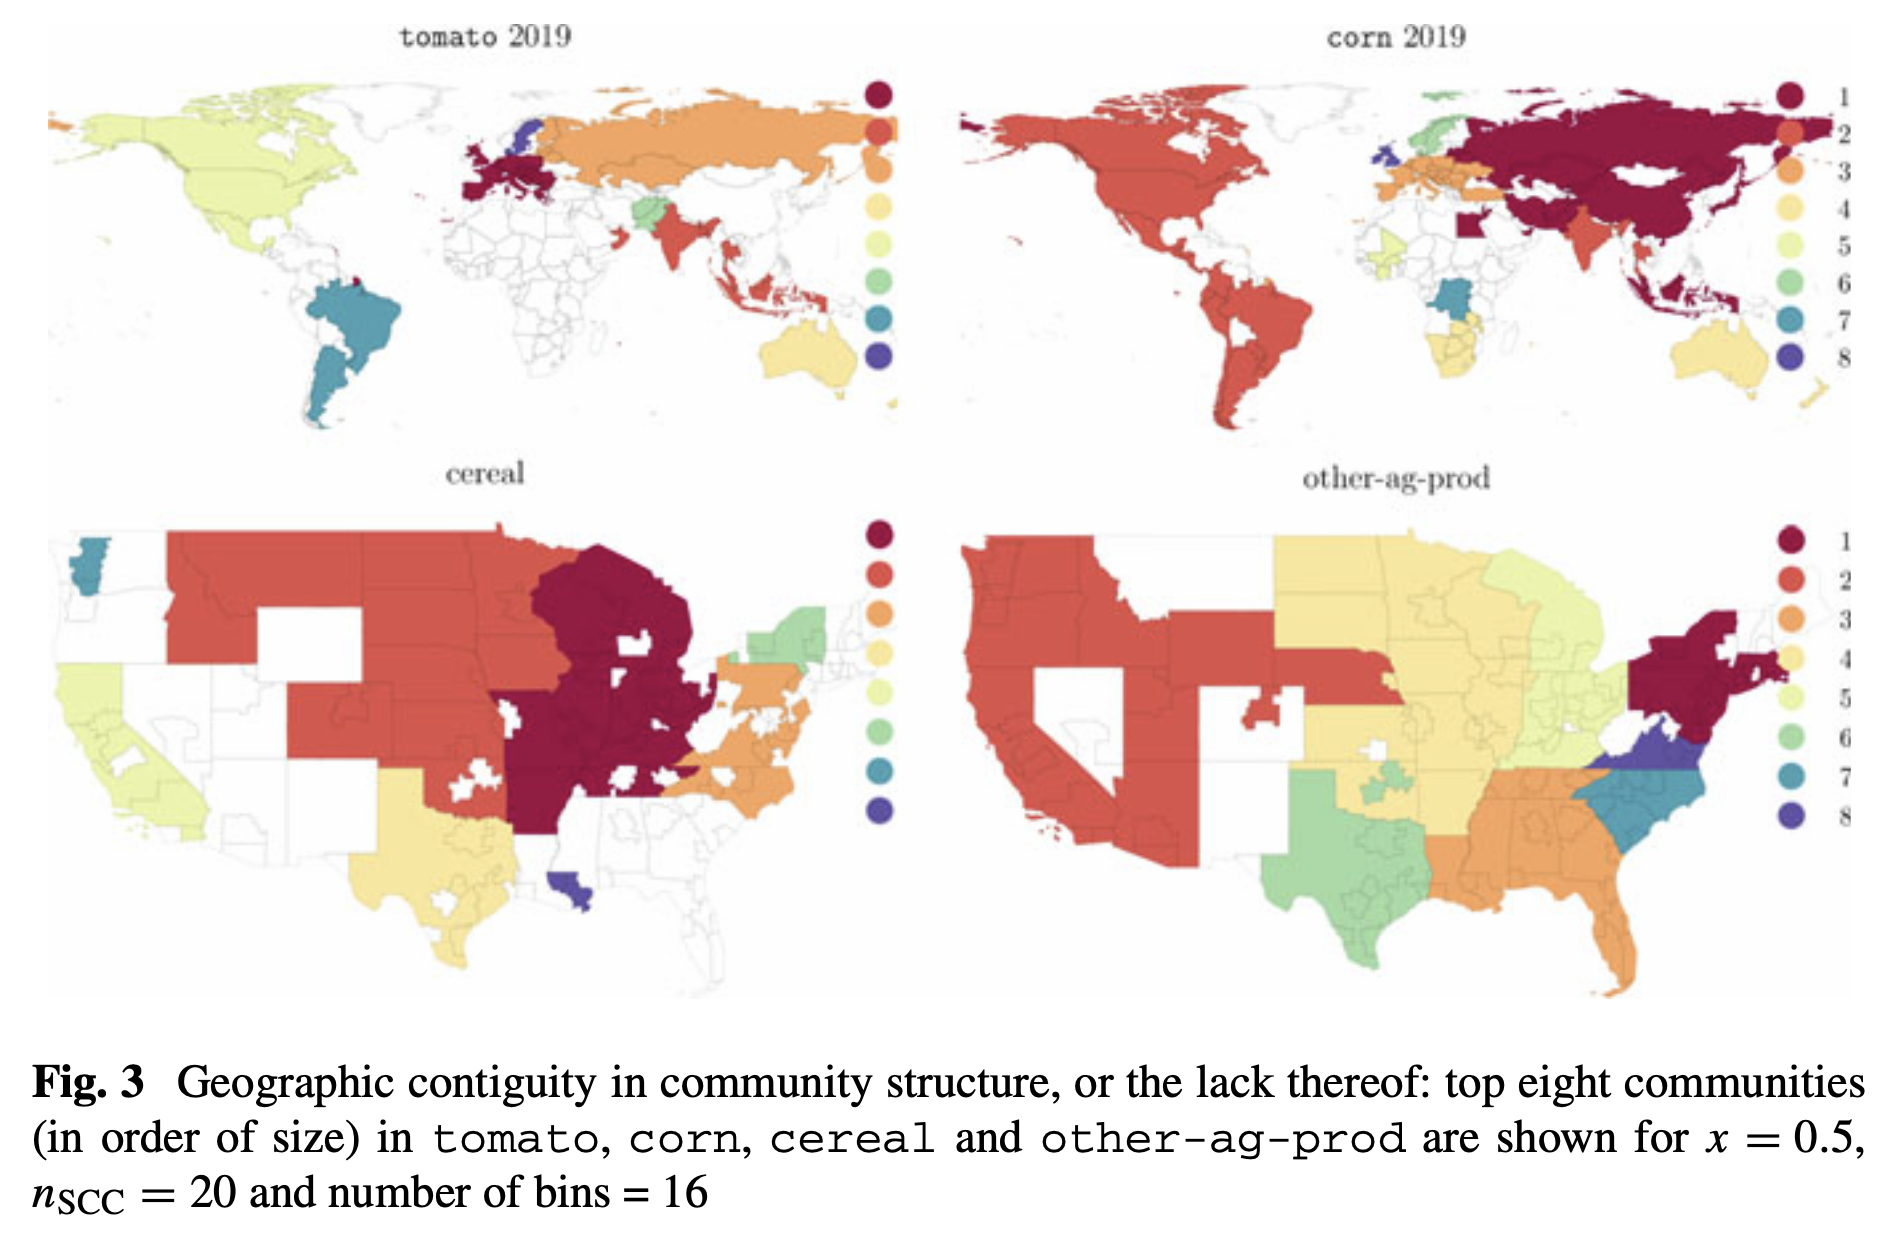
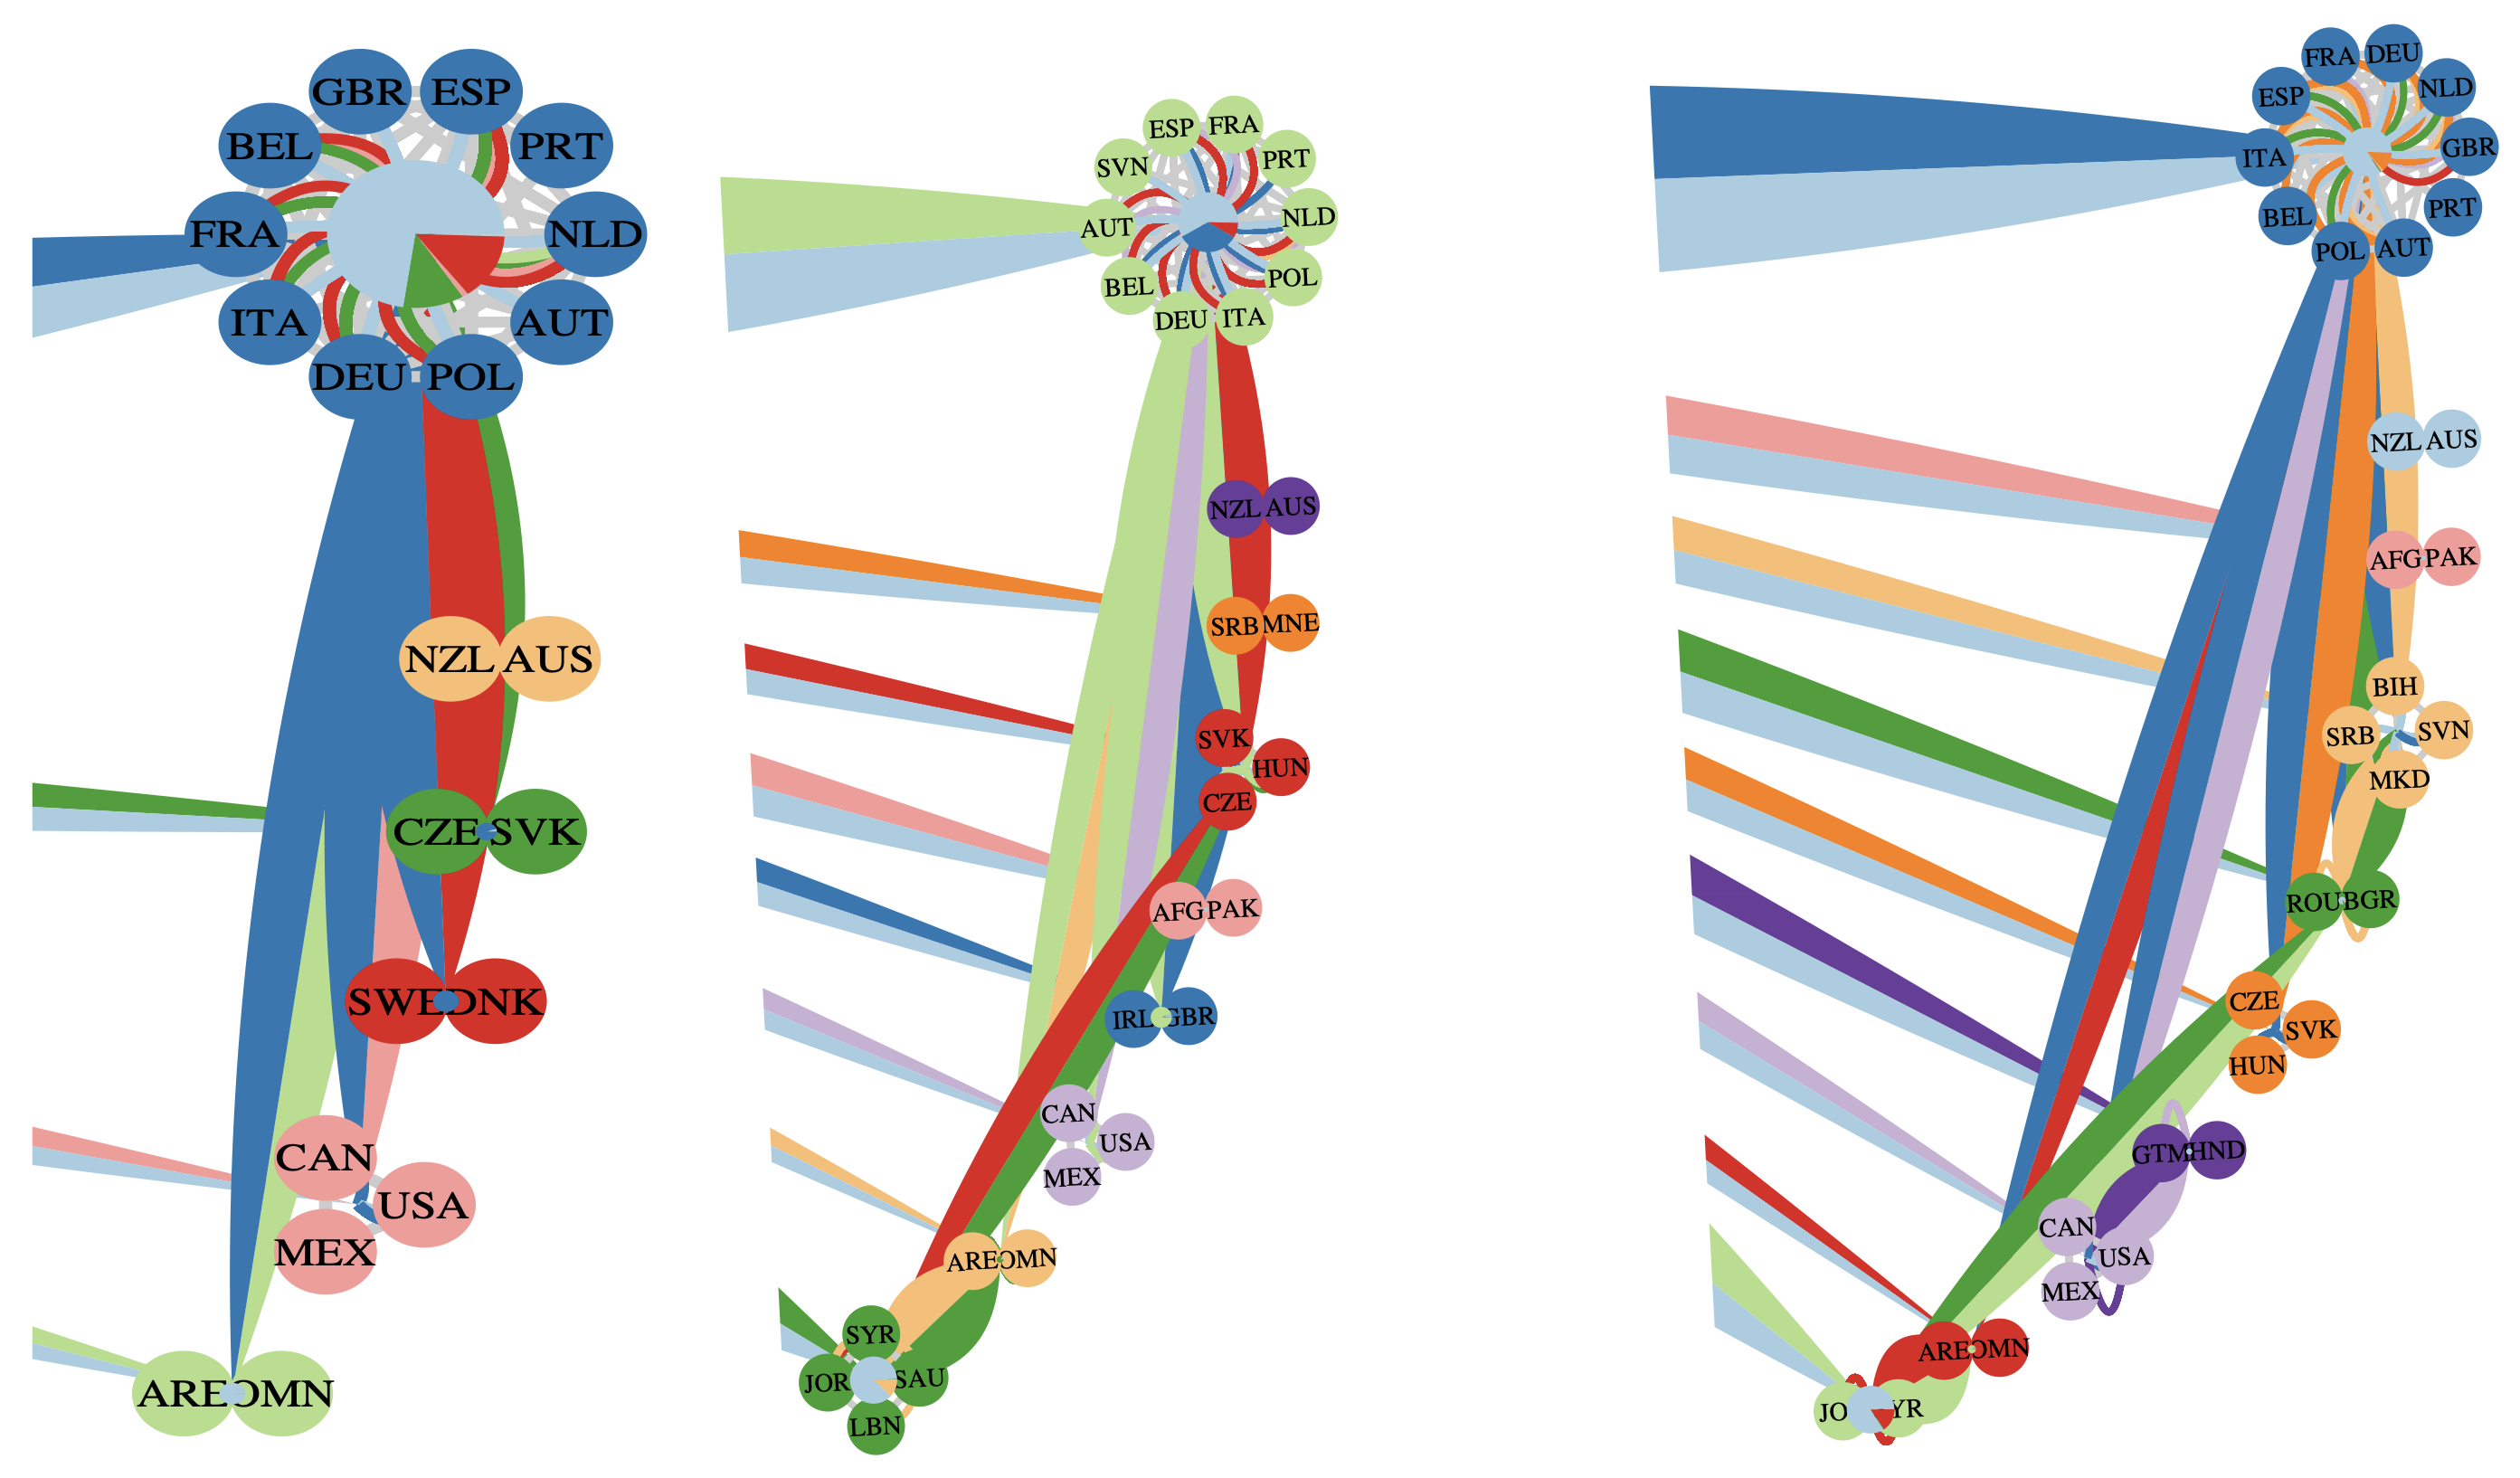
Contagion clusters are identified using a reliability-based algorithm that removes trade edges in order of their marginal contribution to network reliability, until no group of mutually reachable countries exceeds a specified size. This ranks trade routes by structural importance to the contagion process. The fewest trade links whose removal would isolate each cluster, together with its total incoming and outgoing trade volumes, characterise its vulnerability and influence in the wider network.
A stable European cluster — Portugal, Netherlands, Belgium, France, and Spain — appears in the tomato trade network across all years. A distinct North American cluster (USA, Mexico, Canada) is identified separately. Clusters form primarily among geographically adjacent countries with strong bilateral trade, and the structure is robust: stable across different transmission probability values and different thresholds for discretising trade volumes. As total trade volumes grow between 2005 and 2013, clusters expand and fewer countries remain isolated from contagion risk. Forecasting how contagion spreads across identified clusters achieved approximately 96% precision. These clusters mark the highest-priority targets for biosecurity surveillance: a pest entering any one country in a cluster is highly likely to reach the others within the same trade season.
Related Publications
- Mishra, R., Eubank, S., Nath, M., Amundsen, M. and Adiga, A. (2022) Community detection using Moore-Shannon network reliability: application to food networks, in International Conference on Complex Networks and Their Applications, Cham: Springer, pp. 271–282.
- Nath, M. et al. (2019) Using network reliability to understand international food trade dynamics, in Complex Networks VII, Cham: Springer, pp. 524–535.
- Nath, M., Ren, Y., Khorramzadeh, Y. and Eubank, S. (2018) Determining whether a class of random graphs is consistent with an observed contact network, Journal of Theoretical Biology, 440, pp. 121–132.